Nutri-Score Explained: Complete Guide to A-E Food Rating System | 2024 Update
If you are looking for a simple way to understand food labels and make healthier choices, Nutri-Score is the tool you need. This five-color nutrition label assigns every food product a letter rating from A (best, dark green) to E (worst, red), helping you compare nutritional quality at a glance. Created by Santé Publique France in 2017, it helps consumers quickly compare the nutritional quality of similar products.
Whether you are shopping for breakfast cereals, ready-made meals, or snacks, Nutri-Score immediately shows which products you can eat regularly and which should be limited. This guide explains everything about the A-E rating system, how it is calculated, and how to use it for healthier food choices.
What Is Nutri-Score?
Nutri-Score is a nutritional rating system that shows how healthy a piece of food is by placing a label on the front of products so consumers can easily compare nutritional values. The system was selected by the French government in March 2017 after comparing several labels proposed by industry or retailers.
It was created by Santé Publique France, the French public health agency, based on the work of Serge Hercberg from Sorbonne Paris North University. The label is always calculated per 100g or 100ml of food, making it easy to compare different products within the same category.
The A-E Rating System Explained
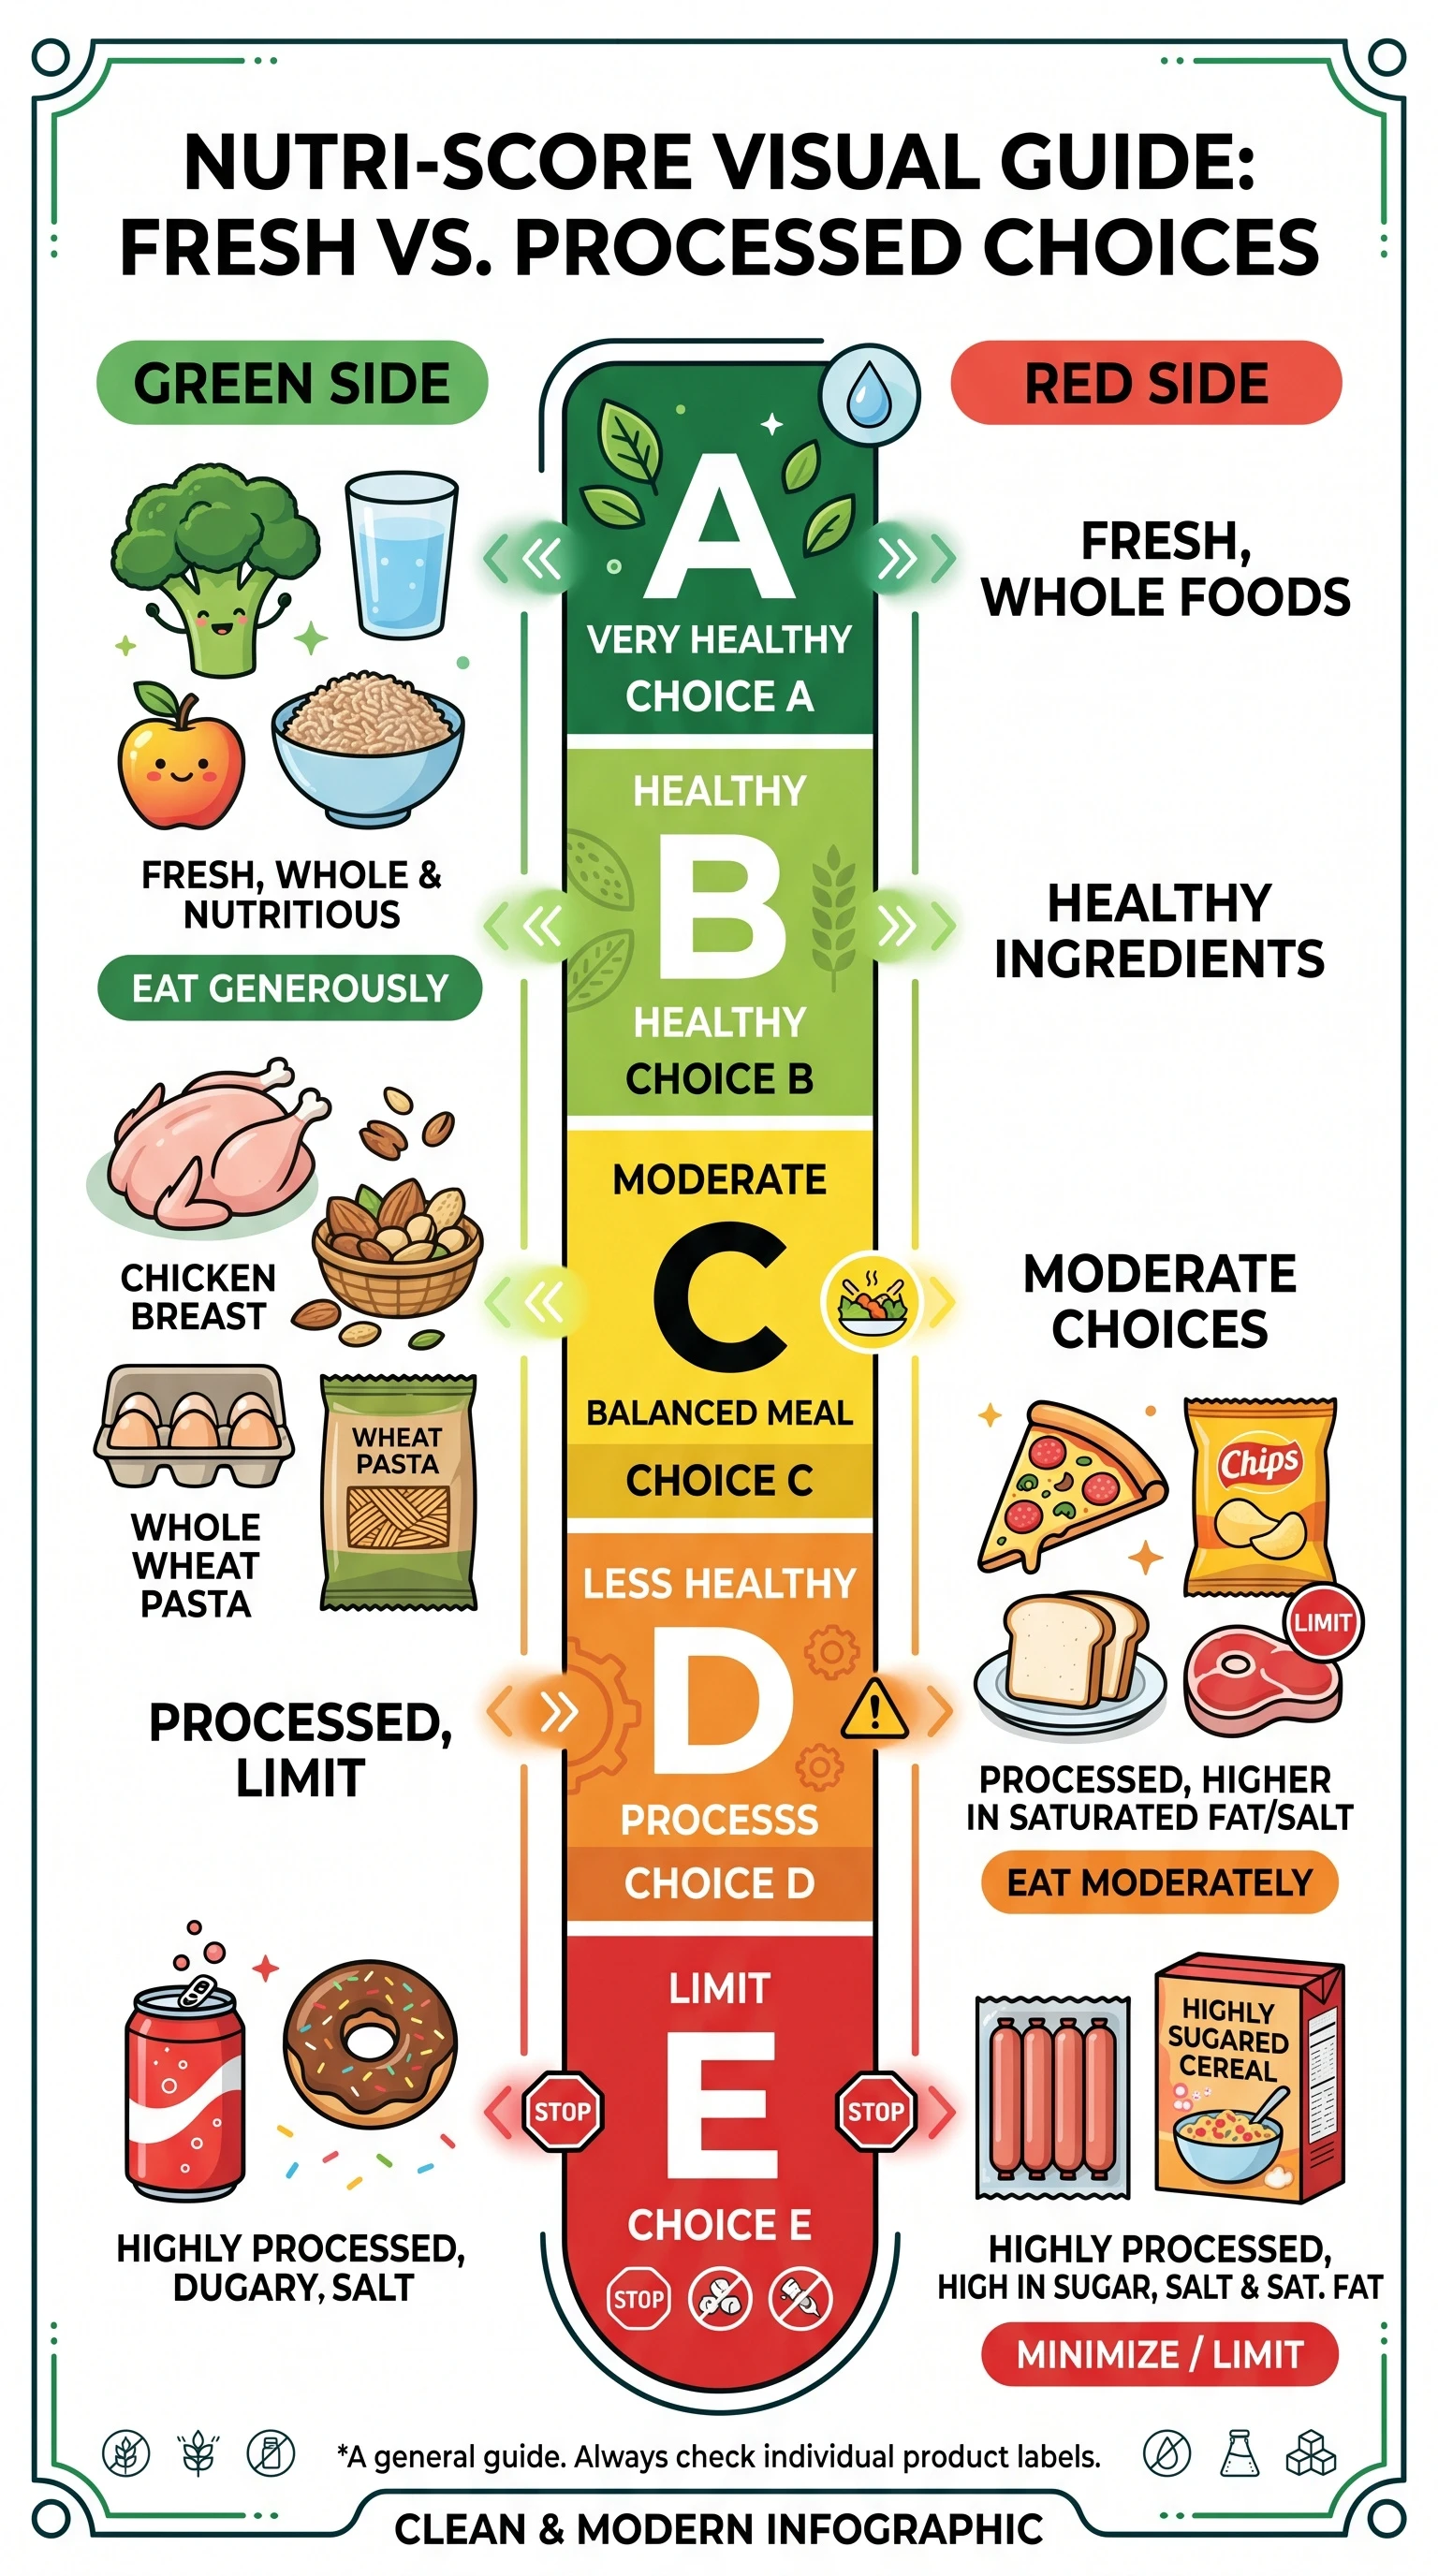
Nutri-Score gives food items one of five classification letters, where A is the best score and E is the worst. Here is a quick breakdown of what each letter means:
| Letter | Color | Numerical Score | Meaning |
| A | Dark Green | Less than -1 | Best nutritional quality, healthy balance |
| B | Light Green | 0 to 2 | Rather balanced product |
| C | Yellow | 3 to 10 | Middle range, moderate consumption |
| D | Orange | 11 to 18 | Rather unbalanced, limit consumption |
| E | Red | Over 19 | Worst, eat in moderation |
A score of A indicates that a product has a healthy balance, while E indicates large amounts of fat, saturated fats, and/or sodium that should be consumed in very moderate quantities. However, this doesn't mean only A products should be consumed or E products should be ruled out entirely.
How Nutri-Score Is Calculated: 7 Key Nutrients
The calculation involves seven different parameters of nutrient information per 100g of food. Before converting to a letter, a numerical score between -15 (best) and +40 (worst) is calculated.
Negative Elements (Should Be Limited)
- Energy (calories) - high energy density per 100g
- Sugars - high sugar content
- Saturated fatty acids - high content
- Salt (sodium) - high salt content
Positive Elements (Should Be Promoted)
- Protein - content of beneficial proteins
- Fiber - fiber content
- Fruits, vegetables, pulses, nuts - proportion including rapeseed, walnut, and olive oils (rule added in 2019)
The total score is calculated as: Negative points (N) minus Positive points (P). The lower the score, the better the nutritional value.
2024 Algorithm Updates
The calculation method was revised in early 2024, with about 40% of products rerated to better reflect their actual nutritional value. The new algorithm takes into account to a greater extent:
- Levels of sweeteners
- Sugar content
- Salt levels
- Fiber content
- Saturated and unsaturated fats
One notable change: semi-skimmed and skimmed milk now receive a higher score than whole milk.
How to Use Nutri-Score for Healthier Choices
The rating is always relative to the product being rated, so a pizza rated A is healthier than a pizza rated C but is still likely to be less healthy than a salad rated C.
Key usage tips:
- Use it to compare similar products (different breakfast cereals, ready-made meals, etc.)
- It immediately shows which products you can eat regularly and which are less suited for a balanced diet
- When choosing between 2 similar products, the A-E rating can be a great tiebreaker
- Variety is important - don't get too hung up on only A or B ratings
- A few D and E dishes won't do harm, but don't eat them for every meal
The Nutri-Score helps consumers understand a product's nutritional breakdown at a glance. It's aligned with health-based nutritional recommendations and helps make more transparent and healthier purchasing decisions.
Countries Using Nutri-Score
Nutri-Score is applied on a voluntary basis in European Union countries including:
- France - first country to adopt (2017)
- Belgium - formally since April 2, 2019
- Spain - voluntary implementation supported November 2018
- Switzerland - 2019
- Germany - 2020
- Luxembourg - 2020
- Netherlands - government introduced January 1, 2024
The system has been recommended by other EU countries as well as the European Commission and the World Health Organization.
Limitations and Important Notes
Nutri-Score provides information about a product's nutritional quality but doesn't account for:
- Presence of additives
- Pesticide residues
- How much processing the product has undergone
- Vitamins and minerals
- Glycaemic index
- Degree of food processing
The system is not intended for comparing products from different categories. The Nutri-Score does not calculate aspects like additives or processing levels, but this doesn't mean they have no impact on health.
Conclusion
Nutri-Score simplifies the cryptic nutritional value table on the back of foods and gives a clear color and letter score directly on the front of packaging. Scientific studies show it's the most understandable form of nutritional labeling, helping consumers make healthier purchasing decisions.
While sticking to only A and B ratings doesn't guarantee a healthy diet, using Nutri-Score as a tool for comparing similar products can significantly improve your food choices. Remember that variety and balance are key to nutrition.
SEO Metadata Summary
| Element | Value |
| SEO Title | Nutri-Score Explained: Complete Guide to A-E Food Rating System | 2024 Update |
| Meta Title | Nutri-Score Explained: A-E Food Rating Guide 2024 |
| Meta Description | Learn how Nutri-Score works: the A-E rating system, 7 nutrients measured, color codes from green to red, and how to use it for healthier food choices. Updated 2024 algorithm. |
| Category | Health & Nutrition |
| Tags | nutri-score, nutrition labeling, healthy eating, food rating, dietary guide, wellness, nutrition education |
Image Generation Prompts
Featured Image Prompt
Create a clean, modern infographic showing the Nutri-Score system: A vertical color scale from dark green (A) at top to red (E) at bottom, with letters A-B-C-D-E clearly visible. Include colorful fresh foods like vegetables, fruits, and whole grains on the green A side, and processed foods like sugary snacks on the red E side. Professional health/informational style, white background, high contrast for readability.
Featured Image Alt Text
Nutri-Score A-E rating system infographic showing color scale from dark green (best) to red (worst) for food nutritional quality
In-Content Image Prompt
Realistic photo of various food packages on a supermarket shelf showing Nutri-Score labels: vegetables and fruits with green A labels, whole grain products with light green B labels, some processed items with yellow C labels, and sugary snacks with orange D or red E labels. Natural supermarket lighting, clear visibility of the color-coded letter labels.
In-Content Image Alt Text
Supermarket food packages displaying different Nutri-Score ratings from A (green) to E (red) on packaging
References
2. Nutri-Score - Simple English Wikipedia
3. What does Nutri Score mean? A colour scale - PowerMeals
4. How the Nutri-Score works - Foodwatch
5. Nutri-Score: how to use a label to improve health and diet - Foodwatch
6. Choose more wisely with the Nutri-Score - Colruyt Group
7. Nutri-Score | Santé publique France
8. Nutri-Score - RIVM (Dutch National Institute)
9. The Nutri-Score Scale—A Tool for Assessing Nutritional Quality - PMC
10. The Nutri-Score algorithm: Evaluation of its validation process - PMC